Your dimensions and metrics are scattered across all the marketing tools you use (Google Analytics, Facebook Ads Manager, Mixpanel Reports, and so on.) How do you consolidate all the data to extract meaningful answers? The intuitive -and outdated- answer is Excel. Fortunately, we are in 2018, and we have a better and free alternative: Google Data Studio. You can connect your Google Analytics and Facebook Ads account, and have all the dimensions and metrics available to create real-time reports. Let’s say you are spending on Facebook Ads to get new users to your blog. The question to ask is then: is the money I’m spending on Facebook increasing the new users tracked by GA? 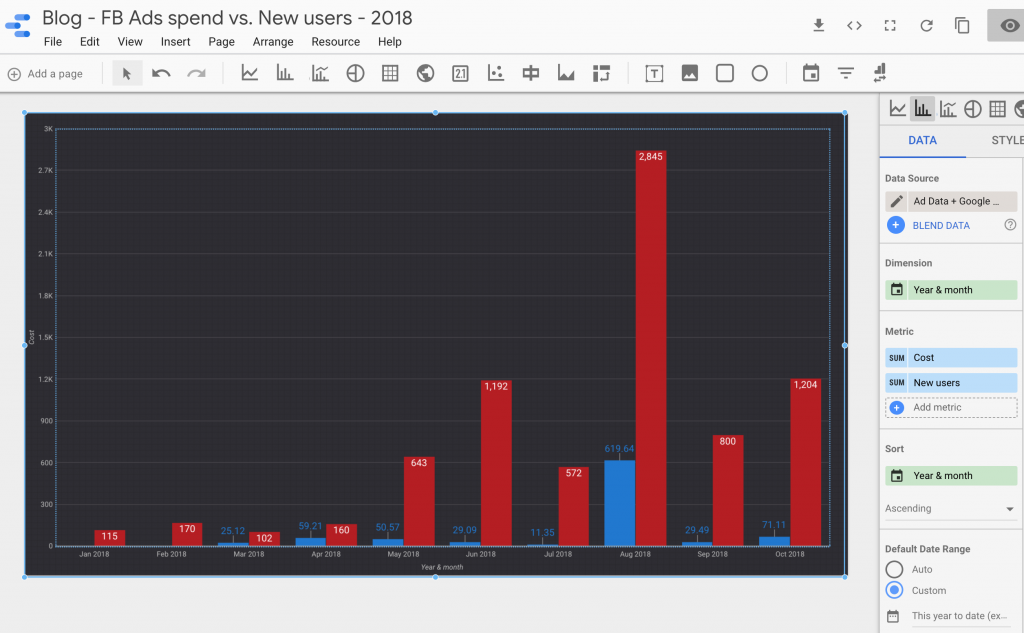 The report is telling you an interesting story: if you spend more on Facebook, you get more new users (Aug.) However, if you look at Jul and Oct, you’ve around the same amount of new users, but you’ve spent $42.02 less money in July. So what happened in July? Something worth to create a new report for!

The report is telling you an interesting story: if you spend more on Facebook, you get more new users (Aug.) However, if you look at Jul and Oct, you’ve around the same amount of new users, but you’ve spent $42.02 less money in July. So what happened in July? Something worth to create a new report for!Founder & CEO at InTheValley
I help startups fix engineering teams that should be moving faster. If you're scaling a startup, you've probably felt the pain: great people on paper, but execution feels slow. I've been building remote teams for startups since 2005 — engineers you can trust who actually deliver and know how to leverage AI to ship faster.
Latest posts by Leo Celis (see all)
- From SaaS to AI Agents - 05/27/25
- The AI Automation Engineer - 05/13/25
- Hire One Developer to Press One Key - 05/06/25