It probably doesn’t make sense to graph the Facebook Ads funnel. After all, you can’t change it: ads are shown, people are reached, they will click on your ads, and eventually, they will convert.
Let’s say out of curiosity we want to see what a Facebook Ads funnel looks like:
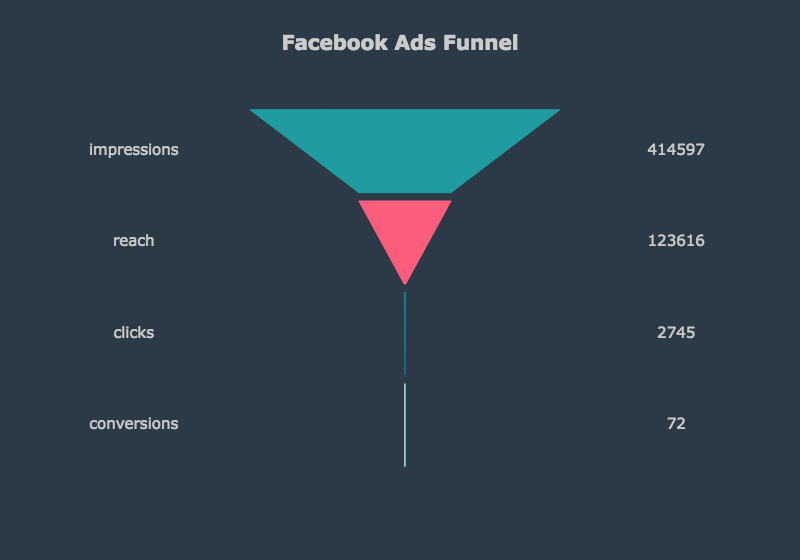
Two things are interesting to see here:
1) In the last step lays the funnel you can control. Assuming conversions is the last mile in your funnel (like a paid customer), what happens between the ad click and the conversion is all in your realm, wether is a website or a mobile app.
2) In the first step of the funnel, the ads were printed 414,597 times, reaching 123,616 people. If you’ve got 72 conversions, it means 123,544 ignored your offer. Even if they clicked on your ad, they weren’t in a good mood, or got distracted, weren’t ready for your offer, or just didn’t care.
One in 1716 people cared enough to convert, to buy from you.
You can change your audience, make your ad creative more appealing, but I doubt you will move the needle enough (maybe one in 1500? 1000?). At scale, if you have a large budget, for sure you will save money. By all means, do it.
The same results you might get by optimizing the funnel you own, between the ad click and your website. Again, if you have a big budget, maybe a 1% conversion rate increase will represent a good amount of saved money.
But the magic really happens when one person who bought from you tell about it to her friends. She might reach 10 friends, and each friend might reach another 10, and soon you are reaching another 1716 people… for free.
This is where the real performance optimization takes place.
(To plot the funnel above, I used this

- From SaaS to AI Agents - 05/27/25
- The AI Automation Engineer - 05/13/25
- Hire One Developer to Press One Key - 05/06/25