There are two primary, no-brainer, unsurprisingly shocking variables to take in consideration when you are designing a reporting tool: time and money.
For most industries, the default time-window view should be MTD (month-to-date) In e-commerce, it is essential to have a day of the week analysis, (sales on Monday are not the same as in the weekends.)
When it comes to money, QTD (quarter-to-date) and YTD (year-to-date) are important for the finance guys: they need to keep track of how much money is getting out at different periods.
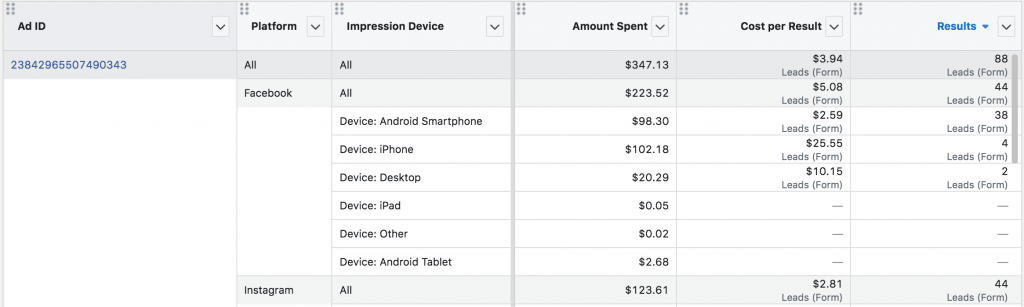
For media analysts, the plot thickens: they need a breakdown by ad channel, device, creative and audience, along with all the relevant conversion metrics (installs, leads, purchases, subscriptions, etc.)
They need to able to answer complex questions like: for a given audience, which creative is generating more volume at lower acquisition cost, for which channel and device? For a more granular analysis, and depending on the campaign goals, Ad formats and geolocation are also relevant.
Charts customizations is a must. The more flexible they are, the better. I haven’t met an analyst that would tell me “I ditched Excel completely,” which means the reporting tool should have export capabilities.
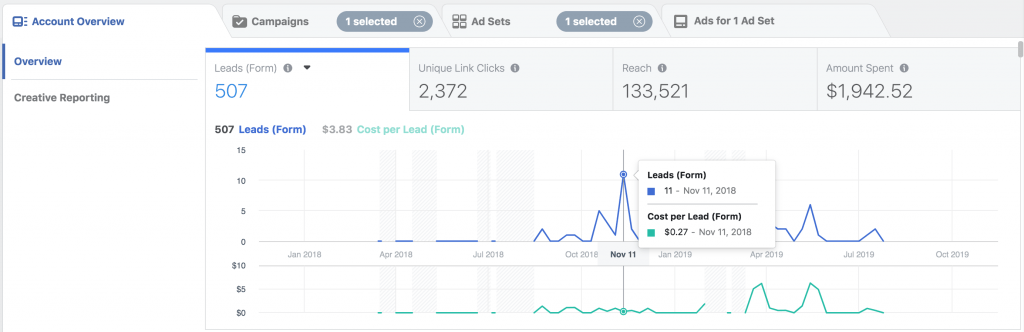
Facebook’s Account Overview and Reporting are great examples of well-designed reporting tools.