A Creative Performance Dashboard will look good on your screen but usually won’t give you any meaningful or actionable insight.
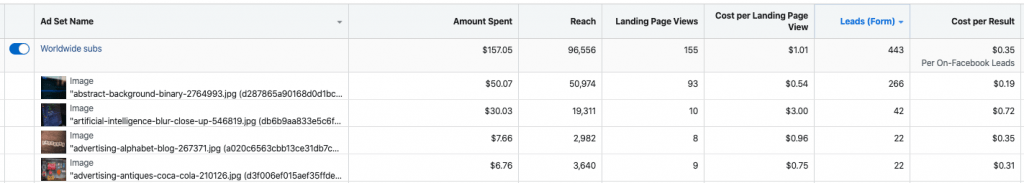
Let’s say you measure your campaign’s performance by leads. Did the first image perform better than the last one? Or is it that you’ve spent more money on it?
The audience, budget spent, time of the day (if it is relevant to your audience), all of that will have an impact between the creatives and the conversions.
There is no direct link between an image and the user. There is a context, whether you controlled (budget) or not (auction), that is affecting the creative’s performance.
What most of the Ads analytics platforms will do (same as with FB Ads Manager) is to collect data, store it, and leave it up to you how to slice and dice the data (a bad idea, when there are so many variables.)
A few hints:
- Only analyze one audience at a time, don’t mix them.
- Group your creatives by money spent. It is not the same analyzing an image where you spent $100, compared with another where you spent $1000.
- Analyze creatives that you launched in a similar time-frame, to avoid the ad fatigue factor influence your analysis.
- Look for outliers: In a ten ads group, targeting the same audience, where you spent $100 each, launched on the same day, if you see one creative that has 50% better performance than the rest, then you know you need to explore further.
It can be tedious analysis work, and I wish products will evolve, so they do the work for you. Until then, make sure you are comparing apples with apples.

- From SaaS to AI Agents - 05/27/25
- The AI Automation Engineer - 05/13/25
- Hire One Developer to Press One Key - 05/06/25